Yesterday's mini crash in a historical context
February 6, 2018
The stock market had a mini crash yesterday. So how big was that in a historical context?
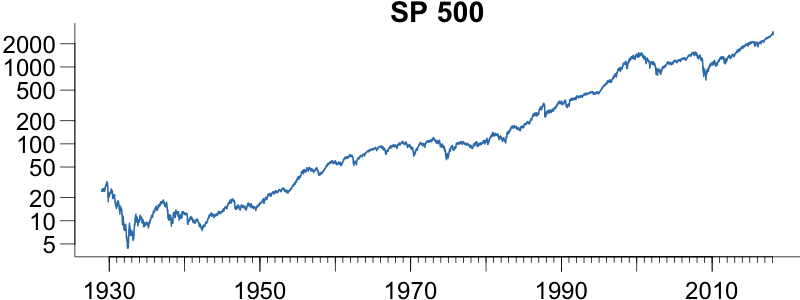
If I take the entire history of daily S&P 500 returns, which I have from 1929, and plot it on a log scale, you can't really see what happened yesterday.
![Using volatility to predict large losses on the SP-500 compared to actual losses](/pics/sp-crash/p1.png)
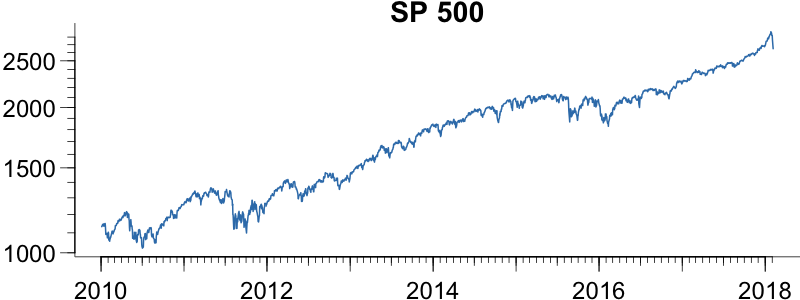
By zooming into this decade, it becomes more clear, and it does not seem to be all that significant.
![Using volatility to predict large losses on the SP-500 compared to actual losses](/pics/sp-crash/p2.png)
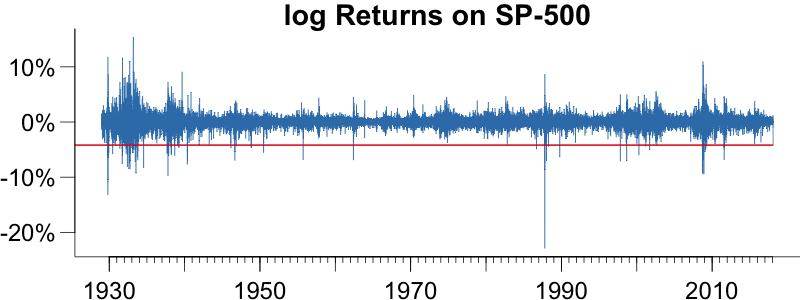
However, still hard to see. So why not look at returns (actually log returns), and for good measure draw a red line through the returns at the magnitude of yesterday's crash. Plenty of worse crashes it seems.
![Using volatility to predict large losses on the SP-500 compared to actual losses](/pics/sp-crash/y1.png)
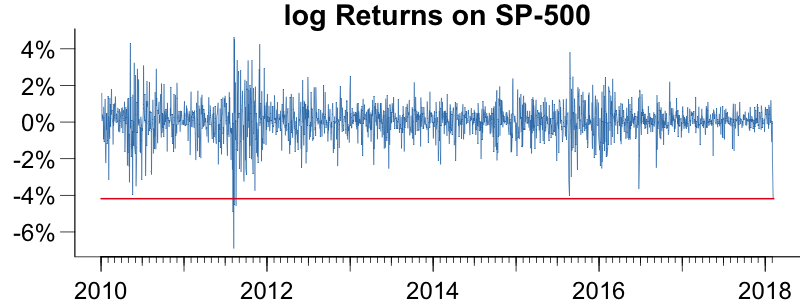
By zooming into this decade, can see that we haven't seen one like it for a few years.
![Using volatility to predict large losses on the SP-500 compared to actual losses](/pics/sp-crash/y2.png)
So how big was the crash in a historical context? Let's look at the biggest drops in my history, and plot them sorted, identifying the two biggest as well as yesterday:
![Using volatility to predict large losses on the SP-500 compared to actual losses](/pics/sp-crash/s.png)
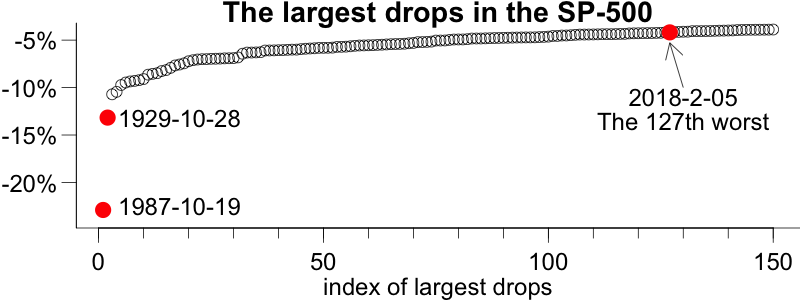
So it was the 127th worst drop. The history is 88 years, so the magnitude of yesterday was a once in an eight month event.
Not really an attack by a dragon was it..
Models and risk
Bloggs and appendices on artificial intelligence, financial crises, systemic risk, financial risk, models, regulations, financial policy, cryptocurrencies and related topics© All rights reserved, Jon Danielsson,